Help
This page has been automatically translated from Spanish to English. There may be some translation errors.
Index
1. Introduction
RS1 Maps is a web application that gives you access to dozens of online maps (more than 180) on various topics, free of charge and in an easy and intuitive way. And not only that, RS1 Maps can become an alternative to services such as Google My Maps and can even be used as a professional GIS (Geographic Information System) tool since you have the option to add bookmarks to the map, create shapes of all kinds or generate routes. In addition, you can easily export and share your personalized maps. And all this without having to register.
My name is Ricardo and I am the creator of this page. This is a personal project and, therefore, I dedicate my free time to it, with no other interest than creating a service that can be useful to me and to anyone who needs access to maps other than those of Google or Bing (which are also included), whether for personal or professional interest. There are no advertisements or any scripts that are not strictly necessary for the operation of the service.
This page is based entirely on third-party map services, whose providers have the rights to them. The copyright information for a map appears at the bottom right of the viewer.
Most of the map services included on this page are free with a usage limit, so to avoid exceeding that limit and so that the map can continue to be used, it is important to make reasonable use of this page. For this same reason, some map services may be temporarily removed if reasonable usage is exceeded.
The map viewer was created thanks to the Leaflet JavaScript library. It's a free, open-source project with a multitude of features. If you want to add a map to your website, I recommend taking a look at it.
English version of RS1 Maps ("mapas.rs1.es/en/") is also accessible with the URL https://maps.rs1.es. Any link with that domain will be redirected to "mapas.rs1.es/en/".
For any suggestions about the page, you can contact me at admin@rs1.es. Also: Mastodon and Bluesky.
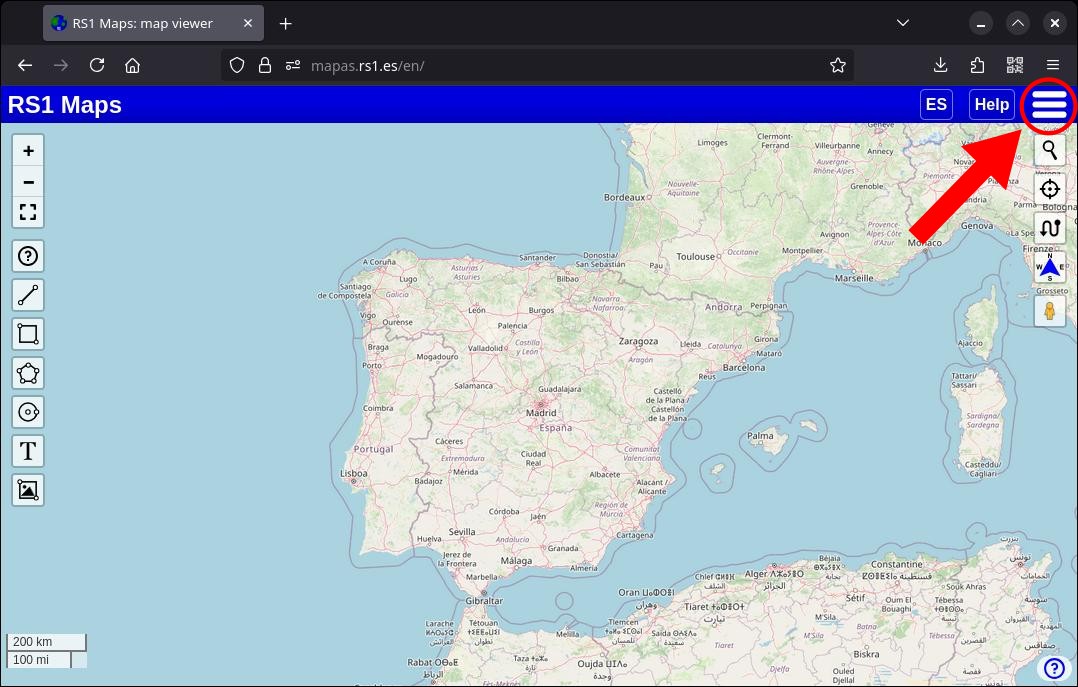
Attention: to access some options on the map, you have to click on the menu icon located at the top right of the page.
2. Select a map
2.1. Base map and additional maps
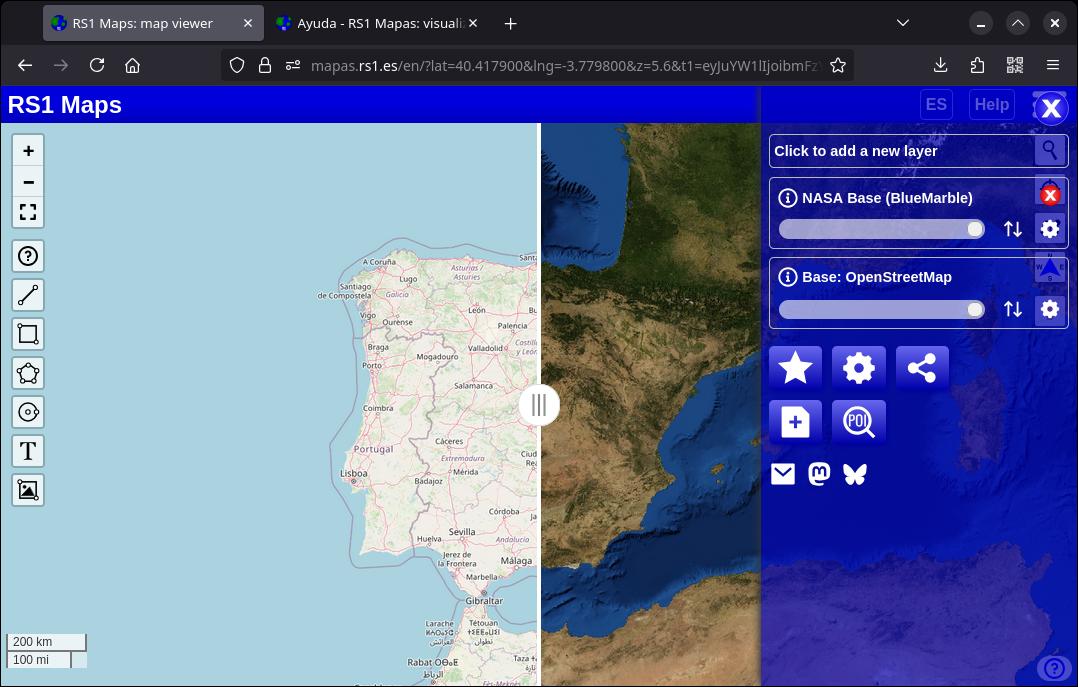
The service supports selecting four map layers: a base map (which is displayed below the rest) and up to three additional maps. This allows you to modify options such as opacity and blend mode (which I'll talk about later), as well as take advantage of maps with transparent backgrounds so you can see multiple maps superimposed at once.
2.2. Select simple maps
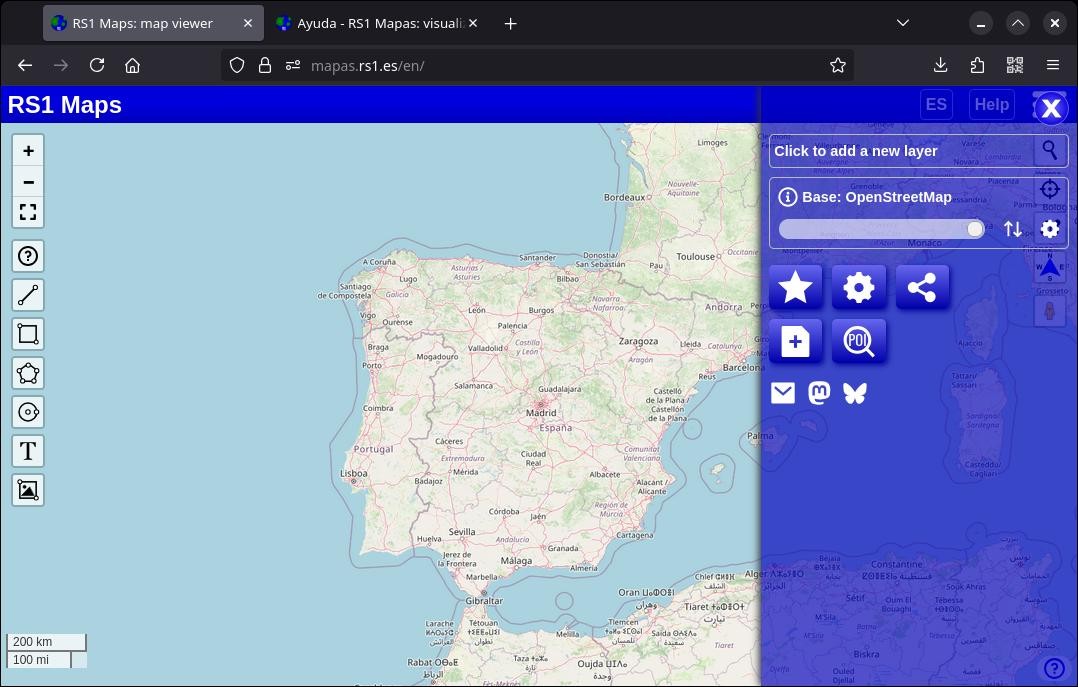
Selecting a map from the list is very simple: just access the main menu, click on the name of the map currently displayed, browse through the different categories and select the desired map. Next to the name of the selected maps there is an information button to show more details about it. Below it there is an opacity control.
If you want to add a map on top, select "Click to add a new layer".
You can move around the map just like with any other map application: drag with your finger to move the map or make a pinch gesture to zoom in or out (you can also use the mouse wheel or double click).
2.3. Select time series maps
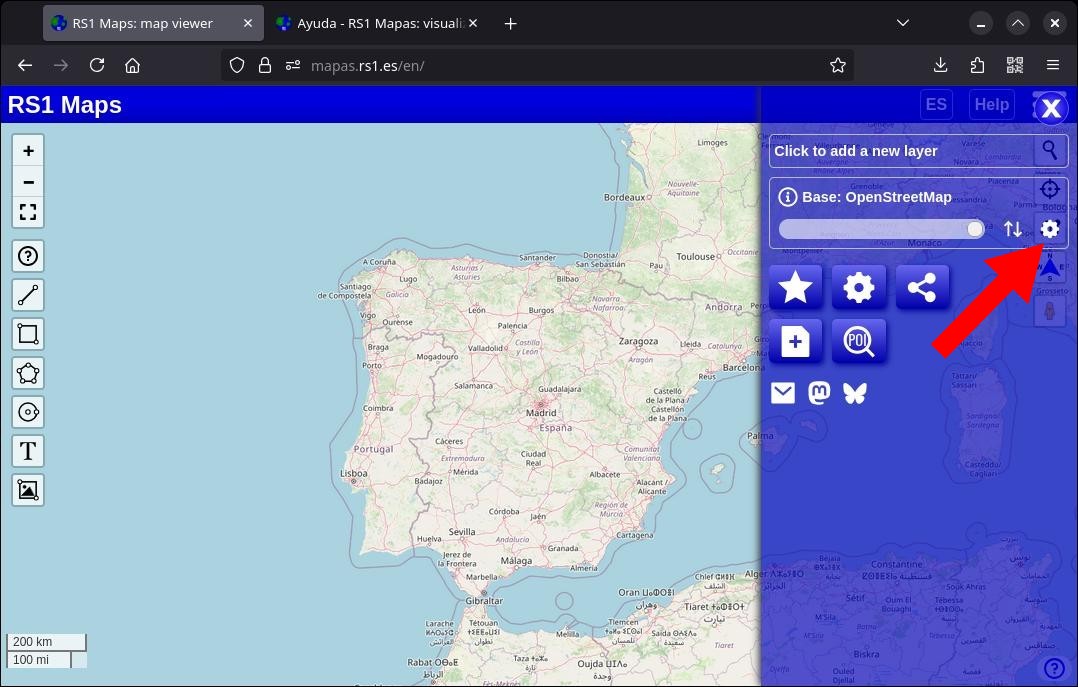
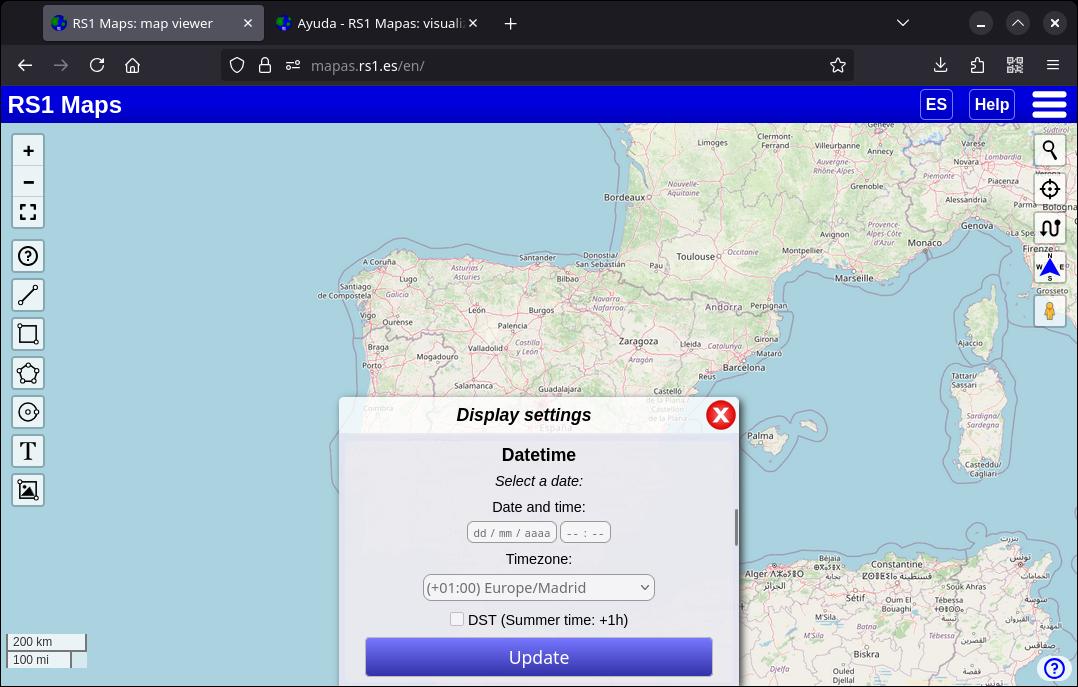
Some maps support selecting a date. Once you've selected a map, clicking on the cogwheel next to its name will reveal a section for selecting a date and generating an animation. Once you've selected a date (some maps also allow you to select a time in addition to the date), click on the 'Refresh' button to see it in the viewer. If you press the button without specifying a date, the current layer will be reloaded.
Remember to select the time zone you want if it is different from the one shown, as well as if daylight saving time needs to be applied.
If you don't add a date, the last available image of the map will be displayed (as long as the map supports this option).
You will notice that, next to the name of a map with a time series (or next to the name of a category), additional information appears in parentheses: first, the time range covered by the map is indicated, and secondly, separated by a diagonal bar, the update period. This data is important for specifying the date and time correctly and when defining an animation. Some simple maps (without a time series) may also show a date in parenthesis, but this is for informational purposes only.
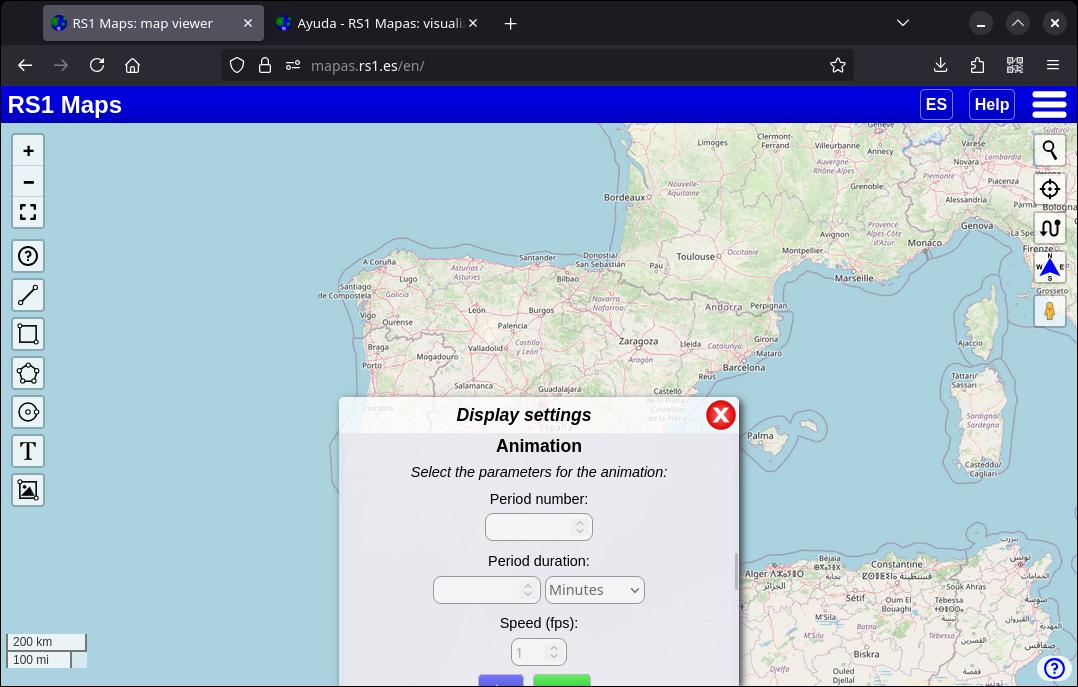
2.3.1. Generate animations
For time series maps, you can animate over a range of dates. Once you've entered a date (which will be the last date in the animation range), go to the Animation section (by clicking on the cogwheel next to the map name) and choose the number of periods (for example, to display 3 "frames" or periods, type 3). Then select the length of the period, i.e. the time range. Add a number and, in the menu that appears just below, the time unit ("Minutes", "Hours", "Days", etc.). For example, if you want to animate 10 images, with a 1-day gap between them, type 10 in "Number of periods", 1 in "Period length", and select Day in the corresponding menu. Finally, you can select the speed of the animation in frames per second ("fps"). By default, if you don't enter any values, the animation will play at one frame per second. There are limitations to the animation speed.
To play the animation, select "Play". You can see that the date changes automatically according to the parameters you entered. To stop the animation, press "Pause". You can use the opacity control (located on the right) to compare the current image with the previous one. You can also change the animation parameters (except the date and time). To reset the animation and be able to change the date and time, select "Restart".
Please note that at the beginning of the animation, it may take a while for the maps to load (until all the frames are cached), so I recommend starting the animation at a slow speed and, once all the frames are loaded, pausing the animation, increasing its speed and starting it again.
3. Bookmarks
3.1. Add a bookmark
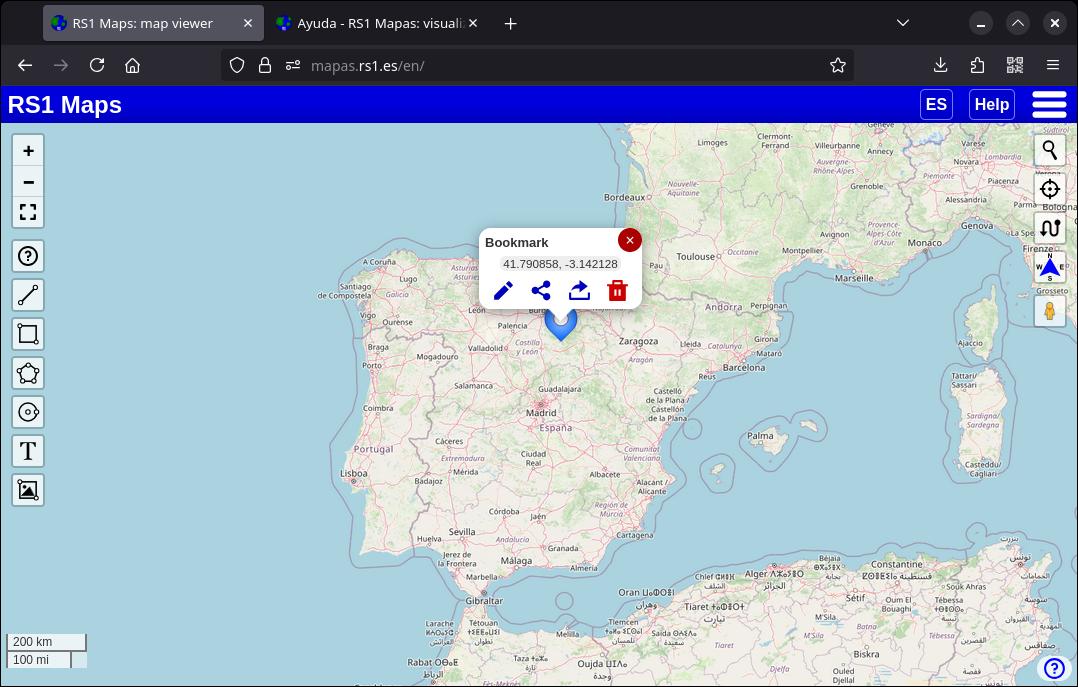
You can add bookmarks or favorites to any map, simply by clicking with the right mouse button (on computers) or pressing for one second (on mobile devices) on the place where you want to create the bookmark. An icon will appear to indicate the bookmark. If you select it, you can see its contents: by default it appears empty, but you can edit it, which is what I'm going to show you in the next section. If you tap on the coordinates, they will be copied to your clipboard.
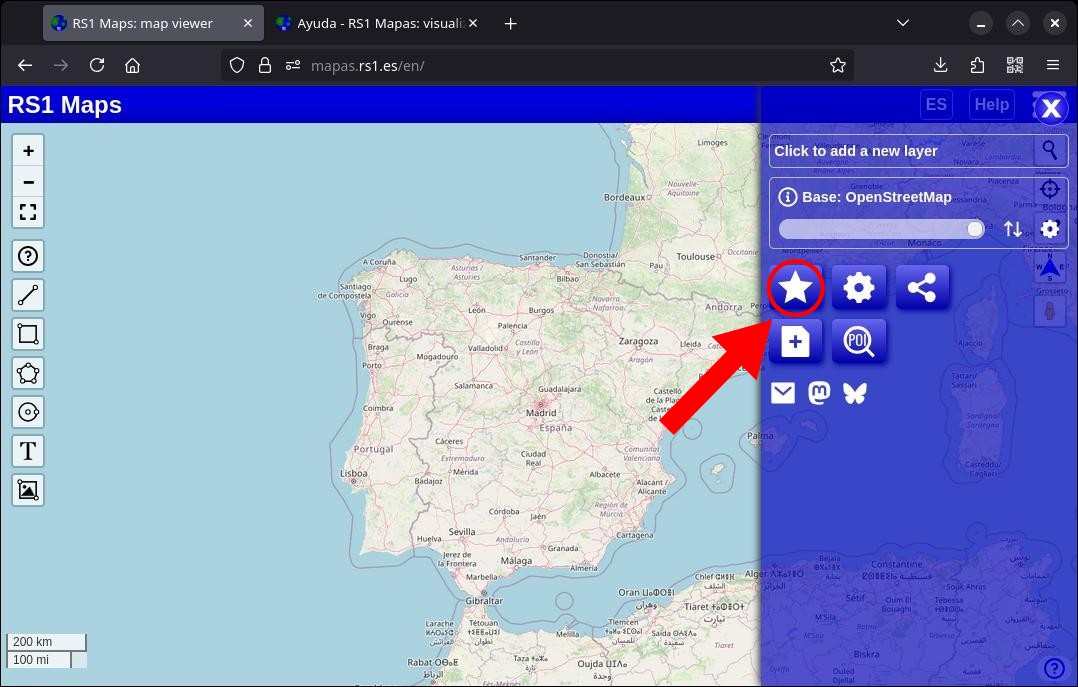
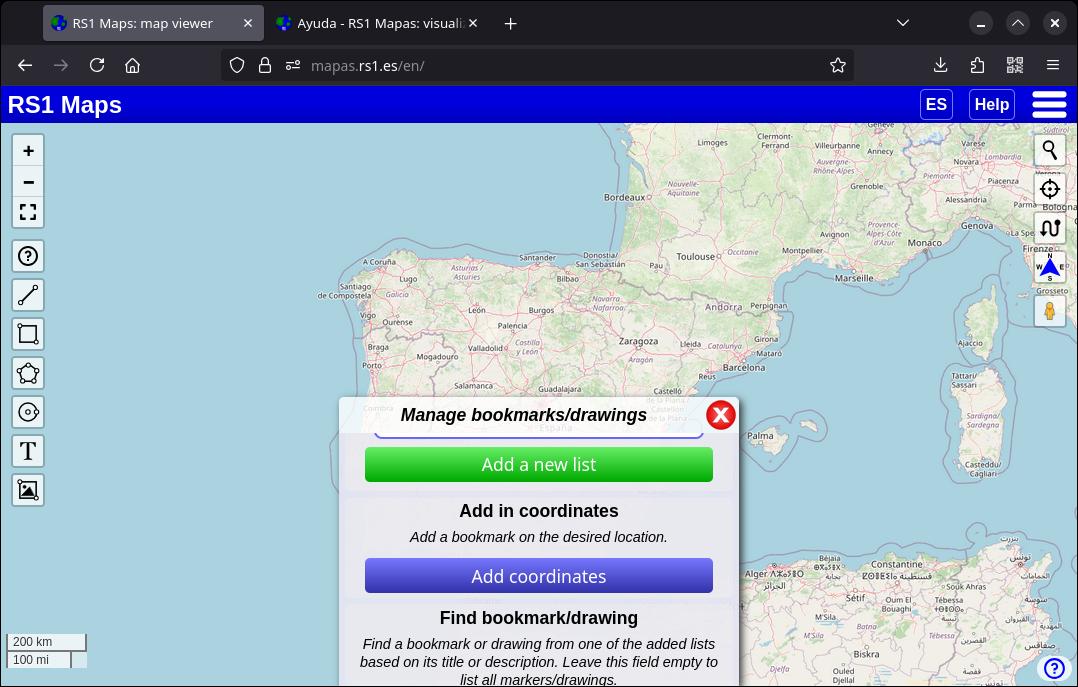
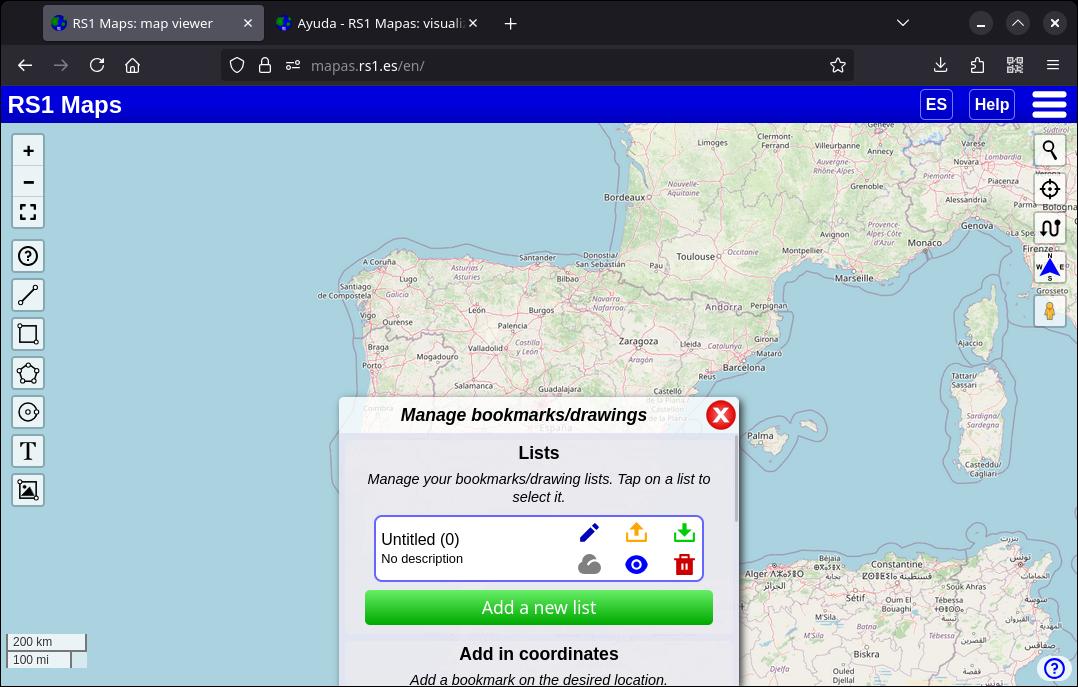
You can also create a bookmark by providing some coordinates: to do this, access the “Bookmarks” menu (blue button with a star), click on “Add in coordinates”.
Enter the coordinates following this format: latitude, longitude (for example: 42.123,5.6523). It also supports coordinates of the type 42.123ºN, 5.6523ºE.
Confirm by clicking on “Add bookmark”. The map will automatically adjust to show the bookmark in the center.
Bookmarks appear above any map, meaning if you change the map once created, they will continue to appear above it. You can even generate animations and keep the bookmarks.
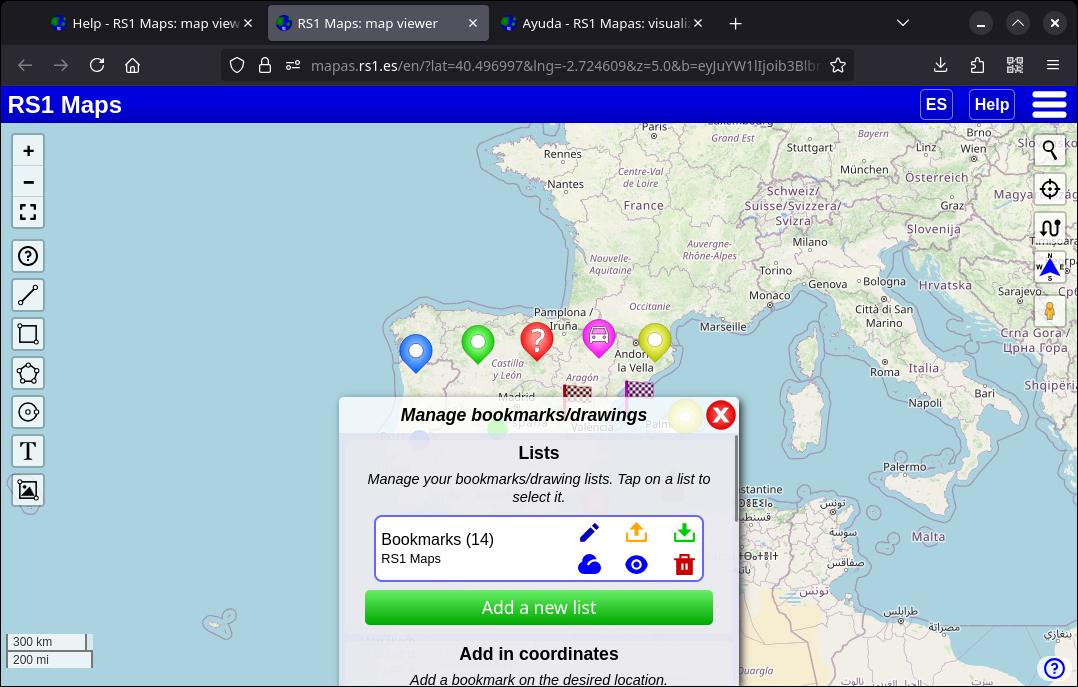
You can organize your bookmarks (and drawings) into lists. By accessing the bookmarks menu, you can edit the list name and description, create new lists, export or delete them. You can also manage your lists as a single collection (using the options in the bar above the lists).
In order not to saturate the map with bookmarks, when there are two or more close enough to each other, they are grouped together and a circle appears with the number of bookmarks that exist in that area. Click on the circle to zoom in on the map and show the bookmarks. You can disable this behavior in the general settings.
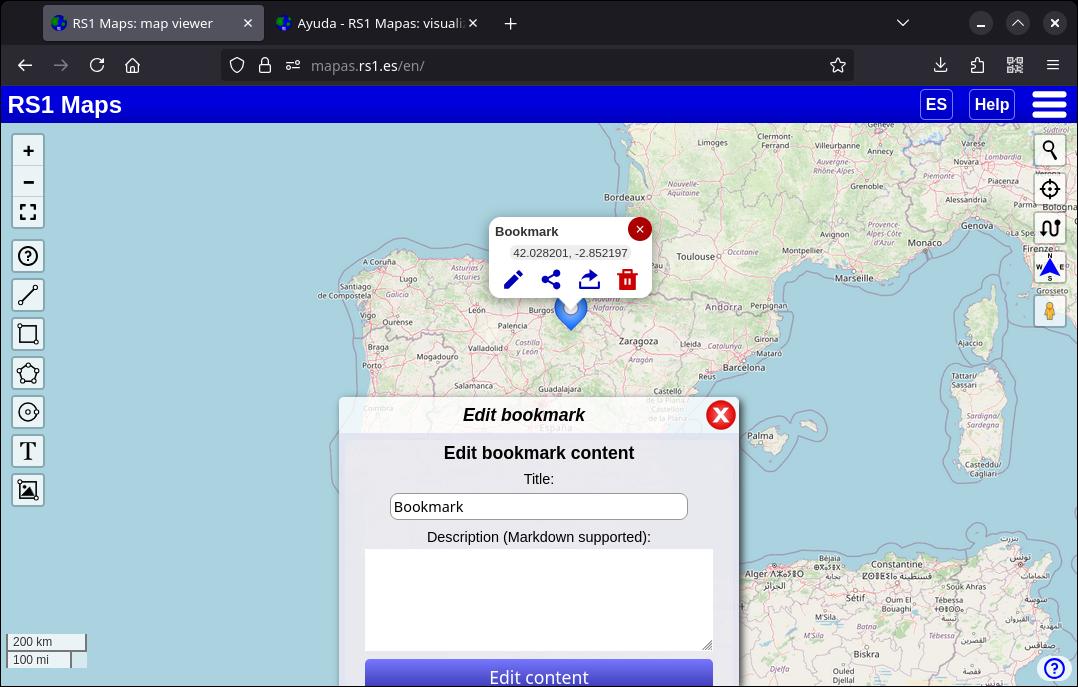
3.2. Edit a bookmark
When you select a bookmark, you'll see that in the box that appears you have the option to edit its content. Click on the edit icon and an edit window will appear. There you can change the title and description. The description section supports both Markdown and HTML tags. You can even add links to images, videos or audio using the respective tags.
For example, to add an image you can type:
                # In HTML:
                <img src="https://ejemplo.com/miimagen.jpg">
                # In Markdown:
                ![image] https://ejemplo.com/miimagen.jpg)
Or to add a video that plays automatically and in a loop:
<video src="https://ejemplo.com/mivideo.mp4" autoplay loop>
The title section only accepts text.
Optionally, you can add an image from your device. This image will be compressed quite a bit (it will have a maximum width/height of 700 pixels) so that it can be exported along with the bookmark without the resulting file taking up too much space. This also allows you to export your bookmarks to the cloud and both the text content and the image will be encrypted on the server.
You can also change the bookmark style or activate "Drag Mode" to change its location. Once activated, drag the bookmark to the desired location. To avoid accidentally moving the bookmark, remember to deactivate "Drag Mode" when you no longer need it.
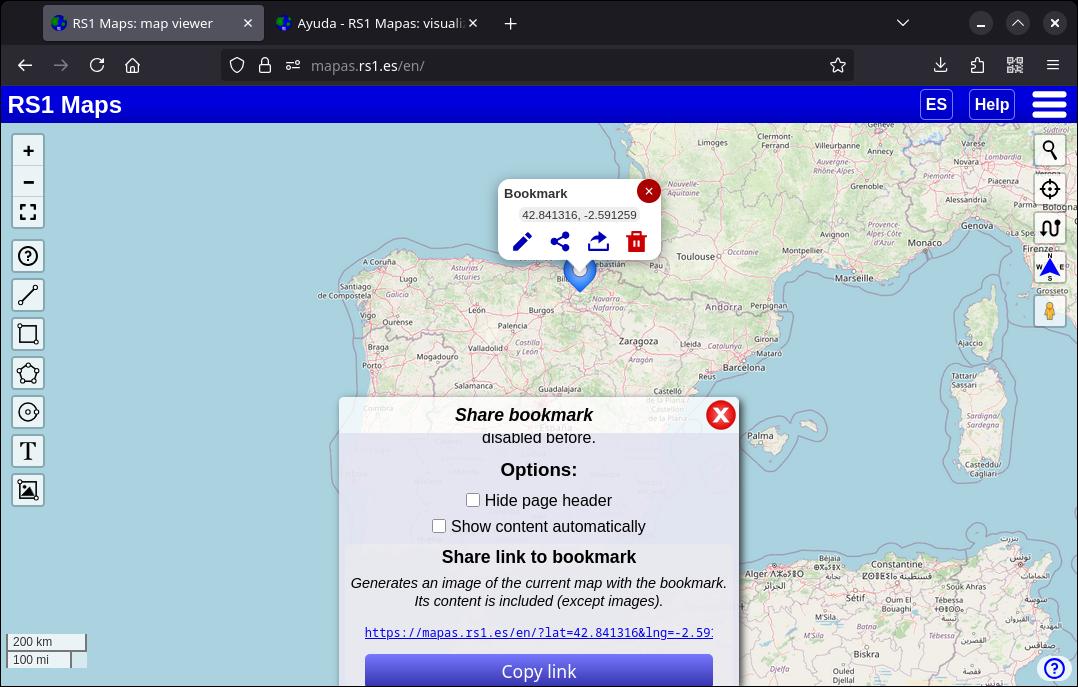
3.3. Share a bookmark
If you want to share a bookmark, click the share button that appears when you open a bookmark. A window will appear where you can share the bookmark in several ways.
If you want to share several bookmarks (as a set), you can find more information in section 11. Import/Export bookmarks/drawings and in 8. Share a map.
3.4. Open in another application
Next to the share button, there is another one that allows you to share your location with other applications or web services.
3.5. Delete bookmarks
You can delete one bookmark or all at once (by deleting a list). To delete a bookmark, select it and click on the trash can icon. Confirm by clicking on “Accept”.
4. Routes
With RS1 Maps you can calculate routes between two or more points and know the distance and time needed to complete them. You have the option of calculating routes on foot, by car or by bicycle. You can also calculate distances in a straight line.
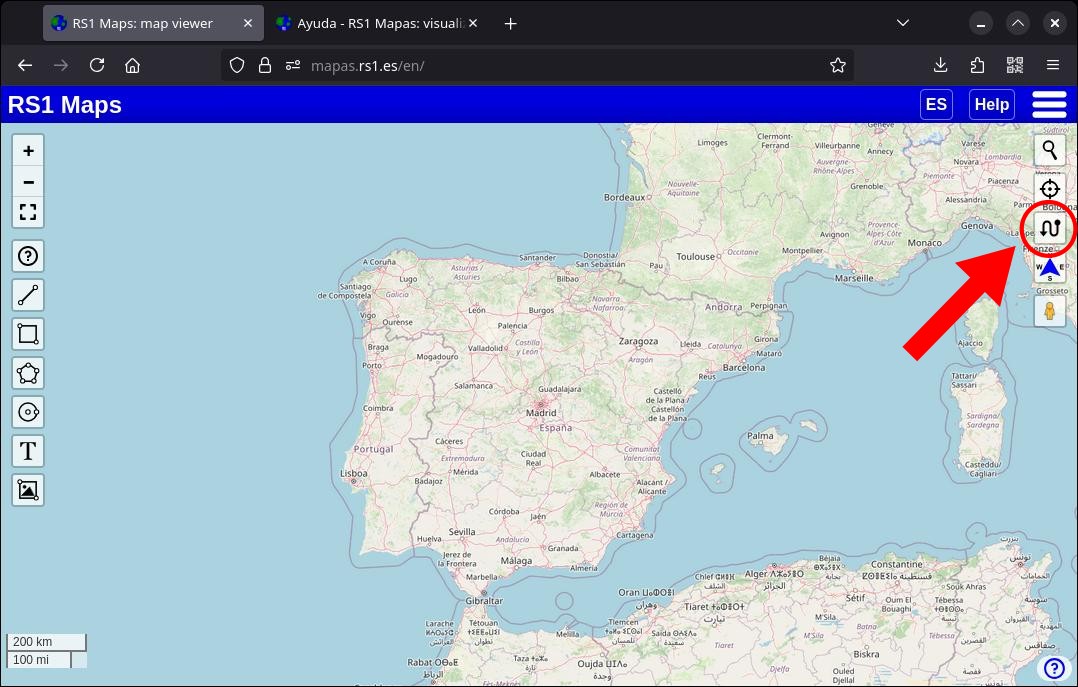
4.1. Route Mode
To generate a route, you first need to click on the "Routes" button (on the right of the viewer). While this mode is activated, you will not be able to edit or delete existing bookmarks.
4.2. Calculate a route
To generate a route, you must first indicate the points of the route in the same way that bookmarks are created (by holding down a point for a brief moment). The minimum number of points needed is two, but you can add as many points as you want (up to a maximum of 25). The first and last points you add will determine the beginning and end of the route (although as you'll see below, you can mark the end of the route as the first point).
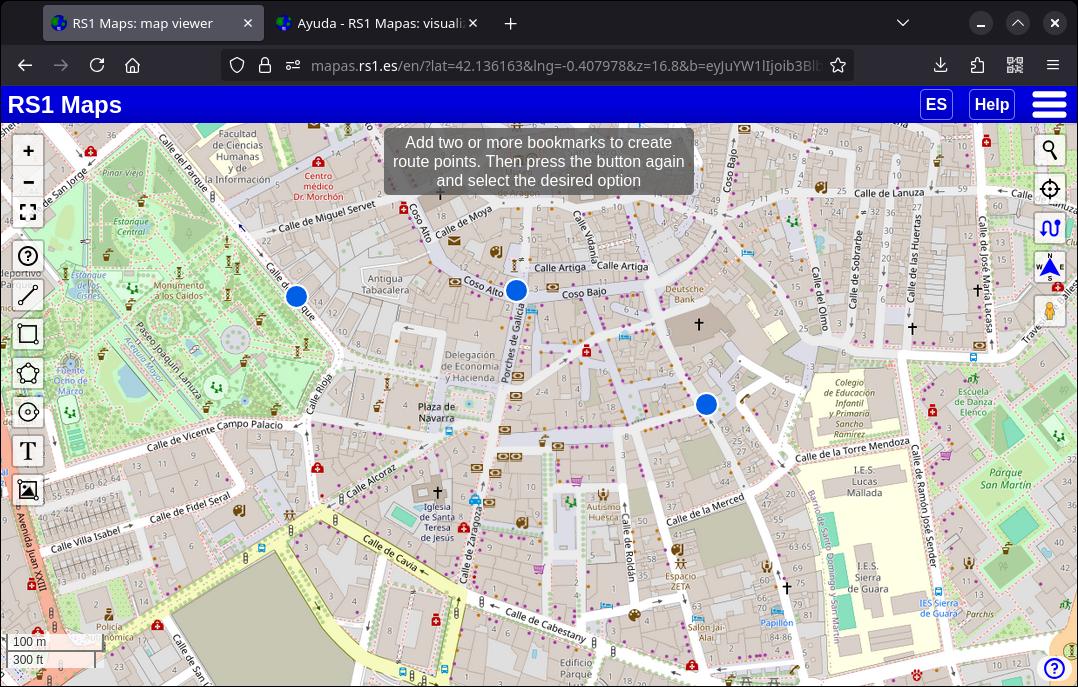
Once the points have been added, click again on the “Routes” button and select one of the options to generate the route: “Walking route”, “Driving route” or "Cycling route". You can choose that the route is circular (that the first point is also the last). The route will be generated and, at the last point of the route, a box will appear with the route data: distance in kilometers and estimated time. Just like creating a bookmark, the coordinates of the point will appear. You can export the route just like you export bookmarks and drawings. If you select the linear route (in a straight line), the partial distance will appear in each of the sections between bookmarks and the total next to the last bookmark.
5. Map controls
Within the map viewer there are a series of “controls”:
5.1. Zoom/Zoom Out
In the upper-left part of the map viewer are the buttons to zoom in (“+”) and zoom out (“-”) the map. It works the same as any other map application.
5.2. Full screen
Just below the zoom buttons is the control to enable and disable the full screen. Press it so that the map covers the entire screen of the device and press it again to return to normal mode. You can also exit the full screen by pressing the Esc key (on computers) or by dragging up from the bottom of the screen (on mobile) to show the navigation buttons and then press the back button. On some mobile devices, when you activate the full screen, you may have to tap on the screen before you can move around the map or select the controls.
5.3. Localization
The "crosshair" icon located on the right side of the viewfinder, allows you to locate yourself on the map using your device's GPS or Wi-Fi. Once you click (and accept the window asking for permission to use the location), your device will try to find your location and, once found, the map will adjust to show it to you.
If you tap the dot that indicates the location, GPS information and several options for sharing the location will be displayed.
To turn off geolocation, click on the control again.
5.4. Search for a place
There are more controls on the right side of the viewfinder. The first one (with a magnifying glass icon) allows you to search for places on the map. This feature works regardless of the selected map. Press the control and type in a place. Press Enter and a list of possible locations will appear. Choose the one that applies. The map will zoom in to the selected location.
5.5. Street-level view
The final control on the right side of the map viewer allows you to view street-level imagery, courtesy of Google's Street View service.
To use this feature, tap and drag the orange dummy icon (called “pegman”) to the desired location (on mobile devices you may first have to press the icon and then click and drag it again). Once you release the dummy, the image at street level will appear in the viewfinder. You can scroll with the arrows that appear and drag to look around.
To exit the view, click on the arrow that appears at the top left.
6. Display settings
You can adjust some visual parameters of each map by clicking on the gear button next to the map name. You can also change some general settings by pressing the gear button in the main menu. The settings you modify in this section are maintained even if you change maps or play an animation (animation performance may be affected).
6.1. Hide controls
Once you have entered the settings, the first option allows you to hide the map controls. Optionally, you can choose to keep the attribution information that appears in the lower-right corner of the viewer. To show the controls again, simply access the settings again and click on “Show controls”.
Once the controls are hidden, you can activate the full screen by clicking on the button that appears at the bottom of the display settings. Remember that you can leave the full screen even when the control is not visible (more information in the full screen control section).
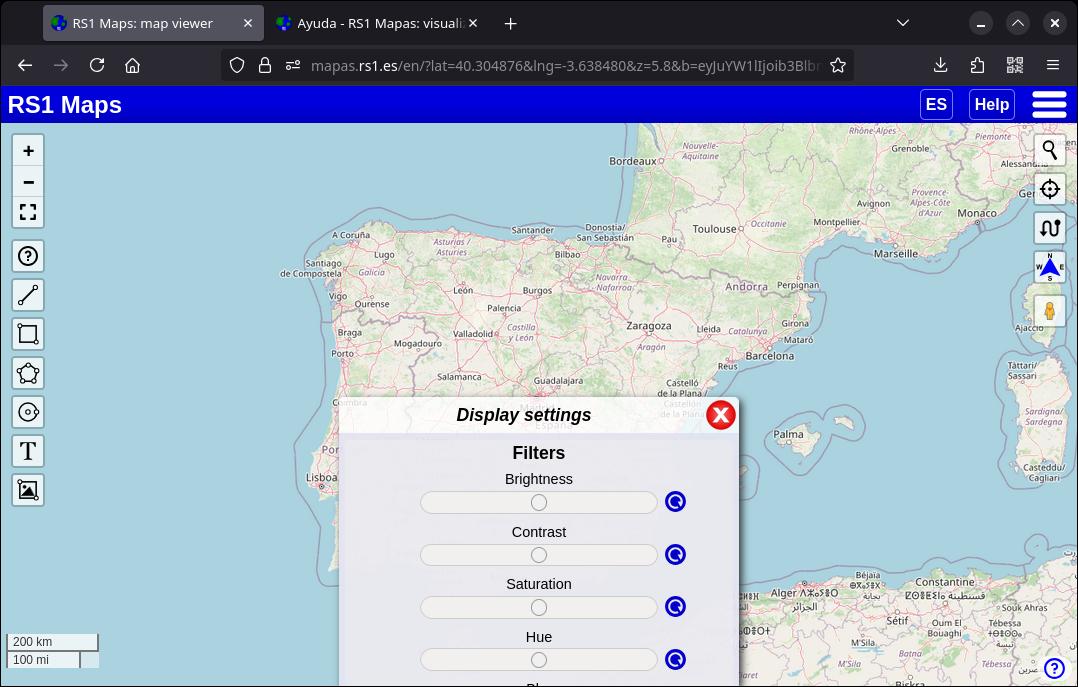
6.2. Apply a filter
(Available in map settings) You can adjust brightness, contrast, saturation and tone parameters of the image. In addition to these parameters, you can also invert the color of the image. Drag the indicator next to each parameter to adjust it. To return a setting to its normal value, click on the icon to the right of each parameter.
As I said before, the parameter changes are maintained if you change the map or play an animation.
6.3. Blend layers
This option is very interesting when you have selected more than one map, since it allows you to visually mix two maps in different ways. Once you have selected and displayed the maps in the viewer, access the display settings and click on the box that appears below the “Blend Layers” button. Select one of the mixing modes. Each mode mixes the maps differently, you can try each one and choose the one that best suits your needs.
To return to normal mode, without blending, select “Normal”.
6.4. Split screen
(Available in general settings) In addition to being able to use the opacity control to view two maps at once, you can activate this setting to view the maps on a vertically divided screen. Once you press 'Split Screen' you will be able to see a control in the center of the viewer that divides the two maps. You can move the control by dragging it left or right, or you can also move the map (the two maps will move at the same time).
This control allows you to see both a basemap and a main map and two images of the same map but with a different date (in the latter case, once an animation has been executed and paused so that the two layers can be loaded). Some maps don't support split-screen.
To turn off the control, go back to the display settings and click “Merge screen”.
6.5. Legend
Some WMS maps include a legend to better understand the map. If you activate this option and the map is compatible, the legend will appear in the lower right part of the viewer.
6.6. Map-specific information
Many WMS maps include an advanced feature called "GetFeatureInfo". This feature allows you to access information about a specific point on the map. Similar functionality has also been added to some ArcGIS maps, and in OSM-based tile maps ("OpenStreetMap", for example) it can give information about nearby points of interest. If you enable this option and the map supports it, clicking on an area of the map will bring up a window with information.
7. Add an custom map
If the map you're looking for isn't in the list, you can easily add it. RS1 Maps is compatible with the most popular map server protocols (WMS, XYZ), in addition to the ArcGIS Living Atlas of the World maps. It all starts by selecting the map layer you want to use, clicking on “Add other maps”. Select the protocol, add the URL of the map and click on “Add”. To delete an added map, simply tap the button next to its name.
7.1. Map servers (WMS, XYZ, etc.)
You can add XYZ, WMS, GeoPackage maps, MapLibre GL styles, or ArcGIS maps. You can also add links to GeoJSON, KML, or GPX files. The first thing is to select the appropriate protocol in “Map Type”
Once selected, type (or paste) the address of the map in the next box.
In WMS maps and in some ArcGIS maps, you need to choose a layer from the map. You can include the name of the layer in the corresponding box. If you don't know the name of the layer in a WMS map, you have the option of searching for it using the “Search for Layers” button. This service searches the file that defines the map for the available layers and displays them in a simple list (ordered alphabetically), located in the same place where the desired layer is typed. Once you click the “Search for Layers” button, its name will change to “Loading” while the service collects the available layers. Once loaded, the list of layers will appear and you only have to select the layer you need.
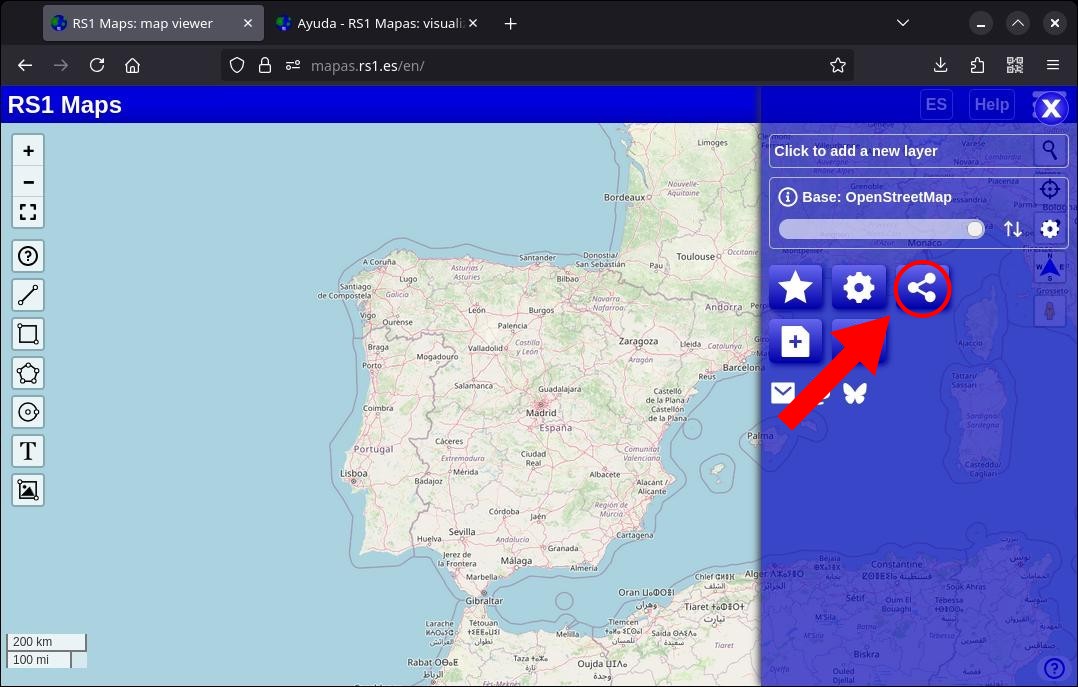
8. Share a map
You can share the map, or in other words, save the current state of the map for quicker access later. Click on the "Share" button. All parameters are saved. Any external maps you've added are also saved, but not the files you've uploaded. Optionally, you can choose to hide the header (to show only the map) or include the collection of bookmarks lists provided you've previously exported it to the cloud (remember that if the collection is private, it will ask for the password to view it). Bookmarks and drawings that are not uploaded to the cloud are not included, but you can export them to a file and share that file.
You can share a link or image of the map. To generate an image, you just have to choose the resolution (the higher the resolution, the higher the quality but also the longer the processing time and the larger image size).
9. Cloud options
In the 'Bookmarks -> Lists' menu, you'll see a cloud-shaped button (to save and manage your list collection). The options in this section are only activated when there is a cloud collection loaded on the page.
9.1. Save changes
This option allows you to overwrite the collection with any changes you've made to your lists. Once pressed, type in the password and confirm.
9.2. Privacy
By default, cloud lists are public, anyone who has the link to your collection (more information in 8. Share a map) or has its code (to import the collection from the menu "Bookmarks -> Import -> From the cloud"), will be able to see its content. You can make a collection private and require a password to view it. A password is always required to edit the collection, change its privacy or to delete it from the cloud.
Once you access the "Privacy" section, you will be able to see if the collection is private or public and change its status.
9.4. Unlink
“Unlink” works when you don't want to continue working with the collection in the cloud (but you don't want to delete it). It's a synonym for “disconnecting from the cloud”. Any bookmarks you have on the map won't be erased, but if you want to interact with the cloud collection again, you'll have to import it again.
9.5. Delete from the cloud
As the name suggests, this option allows you to delete a list collection from the cloud. Remember that, once deleted, it cannot be recovered, so be sure to make a local copy of the bookmarks if you want to save them.
10. Draw on the map
You can draw shapes on the map and even export them to a file. Select one of the buttons on the left of the viewer to start drawing.
After activating the selected shape, mark points on the map just as you would create bookmarks. After that, return to pressing the button for the chosen shape.
Once you have created the shape, you can select it to edit its properties or to delete it.
Note: When editing a polygon, you can create a hole in it the same way you create a bookmark (by right-clicking on computers or pressing and holding on mobile devices). Once you've created the first point of the hole, tap (or click) on each vertex to finish defining it. You can't draw holes when creating a polygon, only when editing it.
11. Import/Export bookmarks/drawings
You can export your bookmarks and/or drawings to save them on your device or in the cloud for later import. Just tap the star-shaped button.
Tap the green icon of the list you want to export locally, or click the icon of the same type in the top bar to export the entire collection of lists. To export to the cloud, tap the cloud icon.
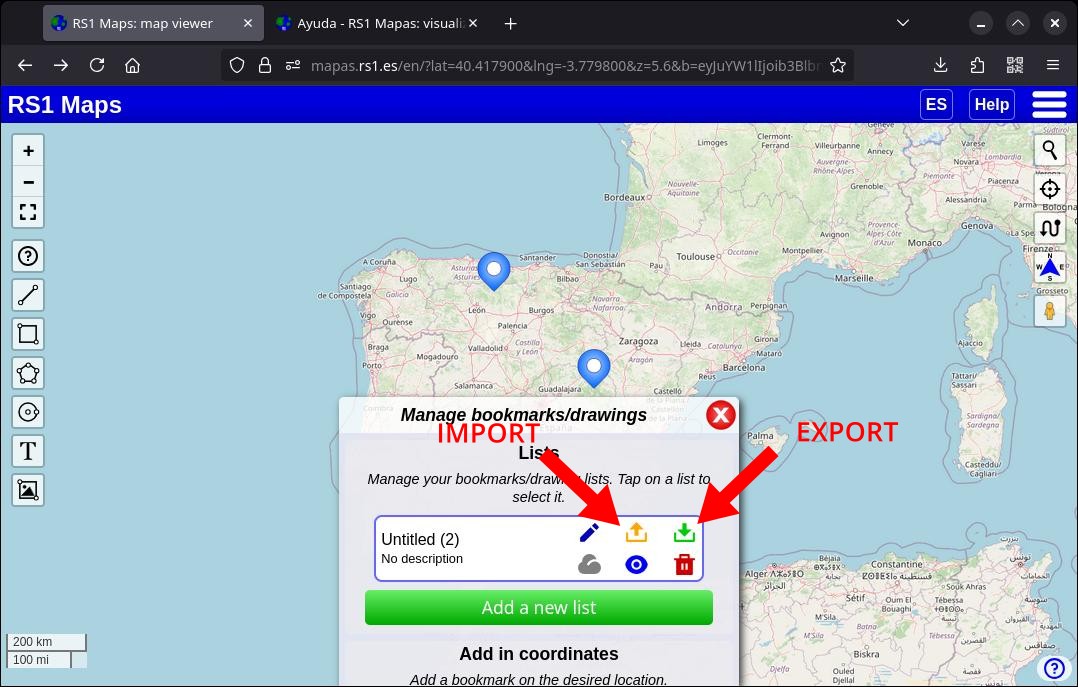
To import bookmarks and/or drawings to the map, tap the orange button of the list you want to import them to (you can create a list first if you don't want to use an existing one). Select 'List from RS1 Maps'. Use the orange button in the top bar to import a collection of lists. To import a cloud collection, tap on the cloud icon. It's very simple and the bookmarks and/or drawings will appear exactly as you created them.
Note: When importing a list, its title and description are also imported only if the list to which it is being added does not have a title.
11.1. The cloud
If you choose to save your bookmarks in the cloud, they will be sent to a server (specifically, a “bucket” without public access to Amazon S3) and will be saved compressed and encrypted. Once you select what you want to export to the cloud, you'll need to enter a password. By default, bookmark collections are public, but you can make them private.
Once exported, the page will return a link to your collecion that you must save (in addition to the password). With that link, you can access your collection later or share it (more information in 8. Share a map).
Once you've created your cloud collection, if you want to save any subsequent changes, click on the button located in the bottom right corner of the screen.
There are limitations to the number of bookmarks and the number of images uploaded from the device that can be exported to the cloud: the collection cannot be larger than 4 MB (compressed, Base64).
Important: Always keep a local copy of your bookmarks/drawings. If you forget the collection code or password, it is impossible to recover it.
In section 9. Cloud options explain more aspects of cloud collections.
11.2. Local file
You have the option to choose your preferred file format: GeoJSON, KML, GPX, or CSV. GeoJSON is the recommended format as it is the only one that saves all drawings and bookmarks with their properties. Use one of the alternative formats only when you need to import the file into another program that does not support GeoJSON. After selecting the format, choose a location and name for the file (on mobile devices you may not be able to choose the name) and confirm.
Optionally, you can choose to compress the file as a ZIP to reduce the amount of space it takes. These ZIP files can be imported without having to be unzipped first.
You can also export drawings to SVG for editing with programs such as InkScape. Note that only drawings that are currently displayed on the screen are exported.
When you choose a format other than GeoJSON, the limitations of that file type for saving map data will be indicated.
12. Import other files
You can also add GeoJSON (.geojson or .json), TopoJSON, KML, KMZ, GPX, WKT, XLS, XLSX, ODS, CSV, XML (OSM), SHP (compressed as ZIP), geotagged JPG or GeoTIFF files that you have on your device. Just click on 'Other files' when importing.
You can import compressed files as ZIP (those created when exporting each list separately or other ZIP files with 'Deflate' or 'Store' compression methods). ZIP files can contain multiple files of the same or different types (except those containing SHP files, which can only contain one SHP file and the files needed to view it).
CSV files must include the column names in the first row (separated by commas). The latitude column should be named "latitude" or "lat", and the longitude column should be named "longitude" or "lon".
In XLS, XLSX, ODS files, the data must be in the first spreadsheet and meet the same column requirements as CSV files.
In some GPX files (for example, those from the OpenTracks mobile app), you can access route data such as distance and time.
13. Search for Points of Interest (POI)
In the main menu, there is a button shaped like a magnifying glass and the letters "POI": these are the acronyms in English for "Points of Interest". With this option you can search for points such as shops, public services, sports areas, etc. within the area of the map that is currently being displayed. This search is different from the one that can be carried out with the search control integrated into the viewer, which searches for towns and streets.
Since it only searches for "POI" within the visible area of the map, if you leave this area you will have to run the search again.
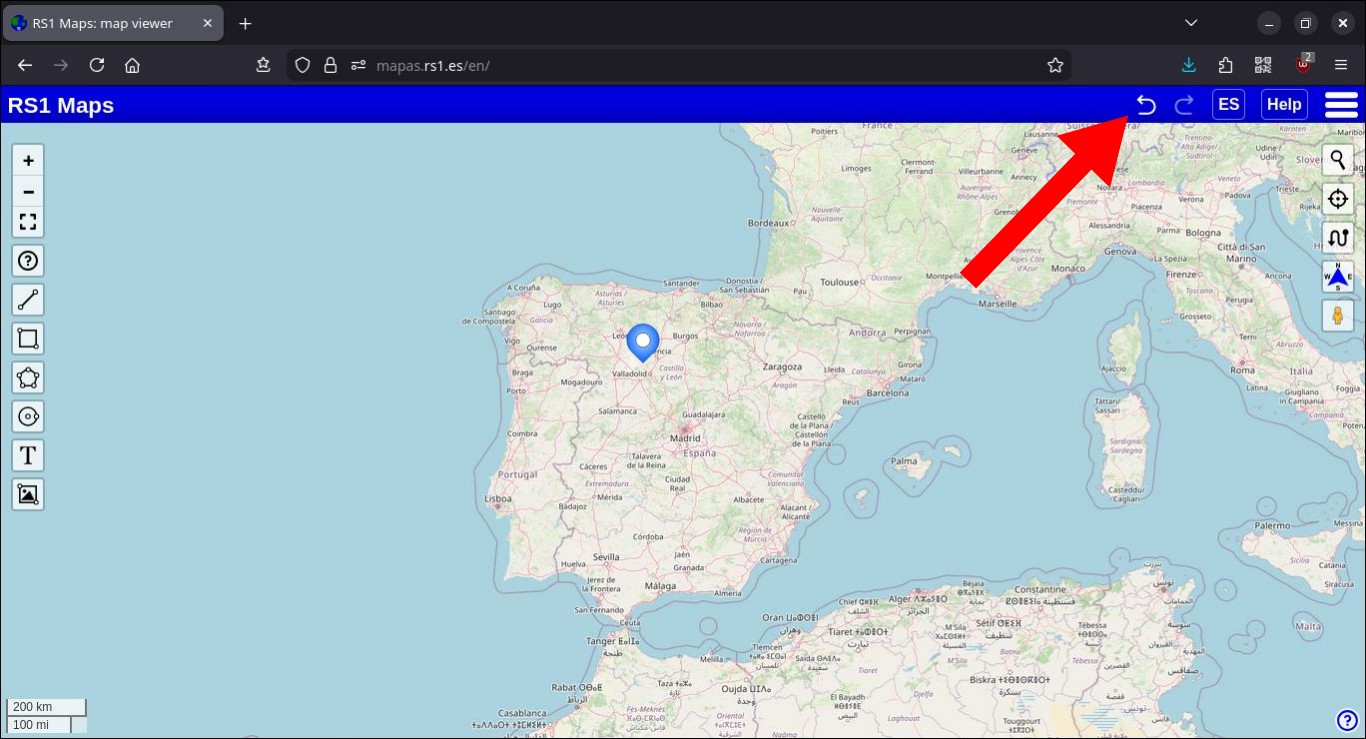
14. Undo / Redo
In the top bar, there are two buttons to undo or redo changes made to bookmarks and drawings. Each button will be clearly displayed when there are changes to undo (or redo if you have previously undone them).
Some changes may not be recorded and cannot be undone. In that case, you can contact me to fix it.
Appendixes
Appendix 1: Map Search Engines
In the following links you can find more WMS (and other types) services that you can use:
- European Environment Agency
- Spatineo Directory
- Open EU Datasets
- IDEE Geoportal (Spain)
- ArcGIS Living Atlas of the World
- National Weather Service (USA)
- Countries borders in GeoJSON
- GeoSeer
- Earthquakes feed from USGS
Appendix 2: Libraries used on the page
- Leaflet
- brunob/leaflet.fullscreen
- perliedman/leaflet-control-geocoder
- Esri Leaflet
- Esri/esri-leaflet-renderers
- Esri/esri-leaflet-vector
- w8r / esri-leaflet-legend
- mapbox/togeojson
- Iván Sánchez Ortega/Leaflet.GridLayer.GoogleMutant
- Raruto/leaflet-pegman
- ProminentEdge/leaflet-measure-path
- Leaflet/Leaflet.MarkerCluster
- ghybs / Leaflet.MarkerCluster.Freezable
- showdownjs/showdown
- digidem/leaflet-side-by-side
- w8r / L.Circle.toPolygon
- Leaflet / Leaflet.Editable
- Leaflet / Path.Drag.js
- calvinmetcalf / shapefile-js
- Google Maps Javascript API
- maptiler / leaflet-maptilersdk
- maplibre / maplibre-gl-js
- maplibre / maplibre-gl-leaflet
- bbecquet / Leaflet.PolylineDecorator
- tyrasd / osmtogeojson
- Stuk / jszip
- vcoppe / Leaflet.ToggleableAttribution
- topojson / topojson
- mapbox / wellknown
- sheetjs / sheetjs
- ngageoint / leaflet-geopackage
- GeoTIFF / georaster-layer-for-leaflet
- exif-js / exif-js
- Turf.js
- makinacorpus / Leaflet.TextPath
- photopea / UTIF.js
- IvanSanchez / Leaflet.ImageOverlay.Rotated
- Open-Meteo
- Copernicus DEM
- Remix Icon
- Overpass API
- Puppeteer
- TimeZoneDB
- Mapbox API
- Open-Elevation API
- Open Topo Data
- Weather API
- Esri API
- Azure Maps
- HERE Maps
- Thunderforest
- MapTiler
Appendix 3: Examples of use
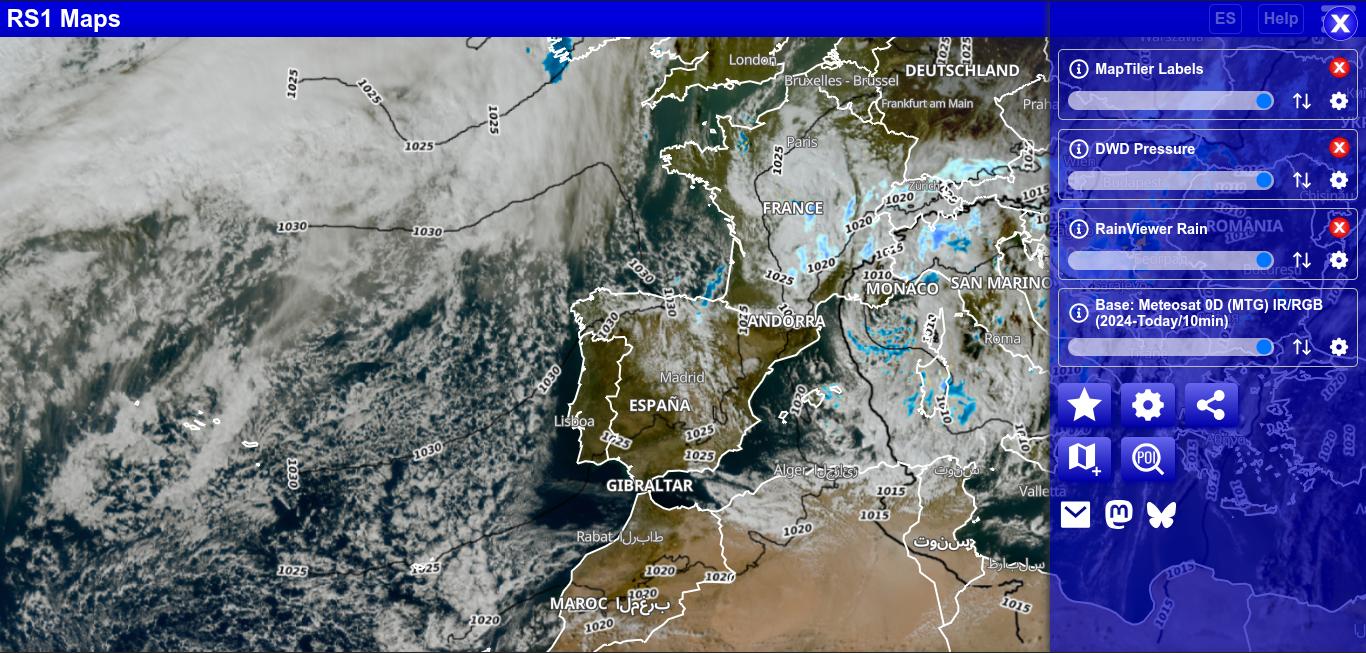
Four layers map
This map shows four layers at once.
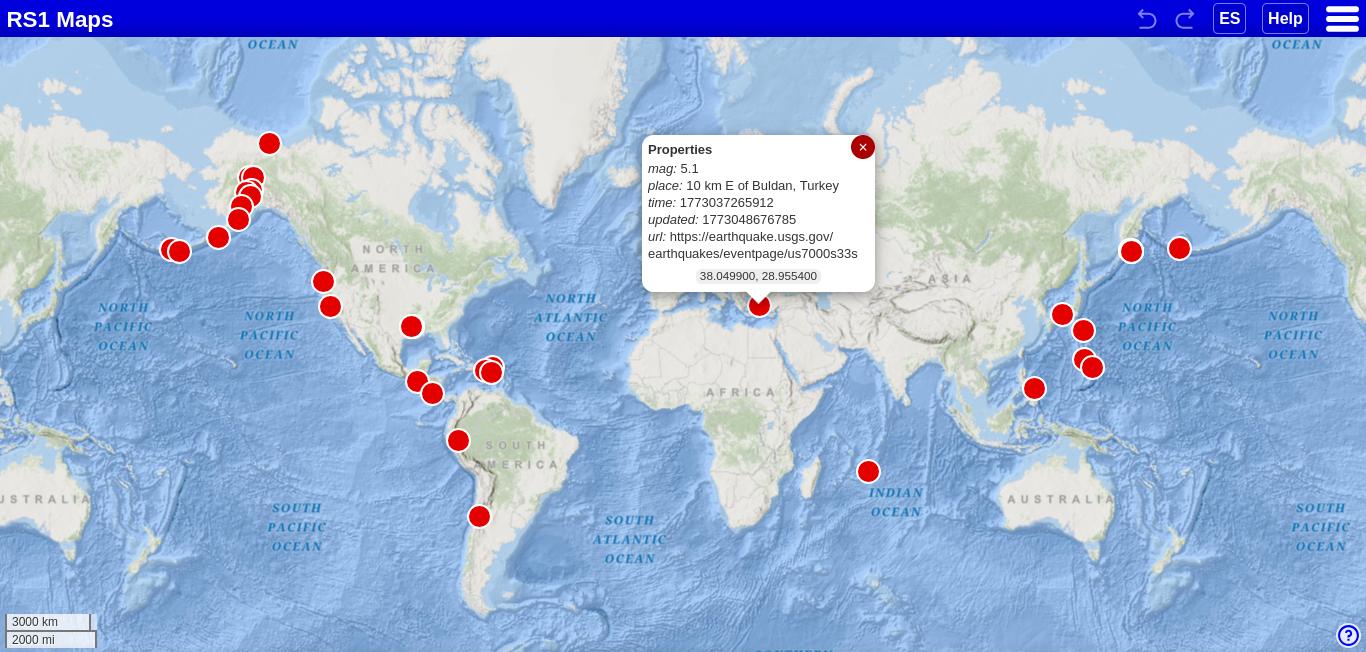
Earthquakes in the last 24 hours
This map loads a GeoJSON file from the USGS website to show the most recent relevant earthquakes.
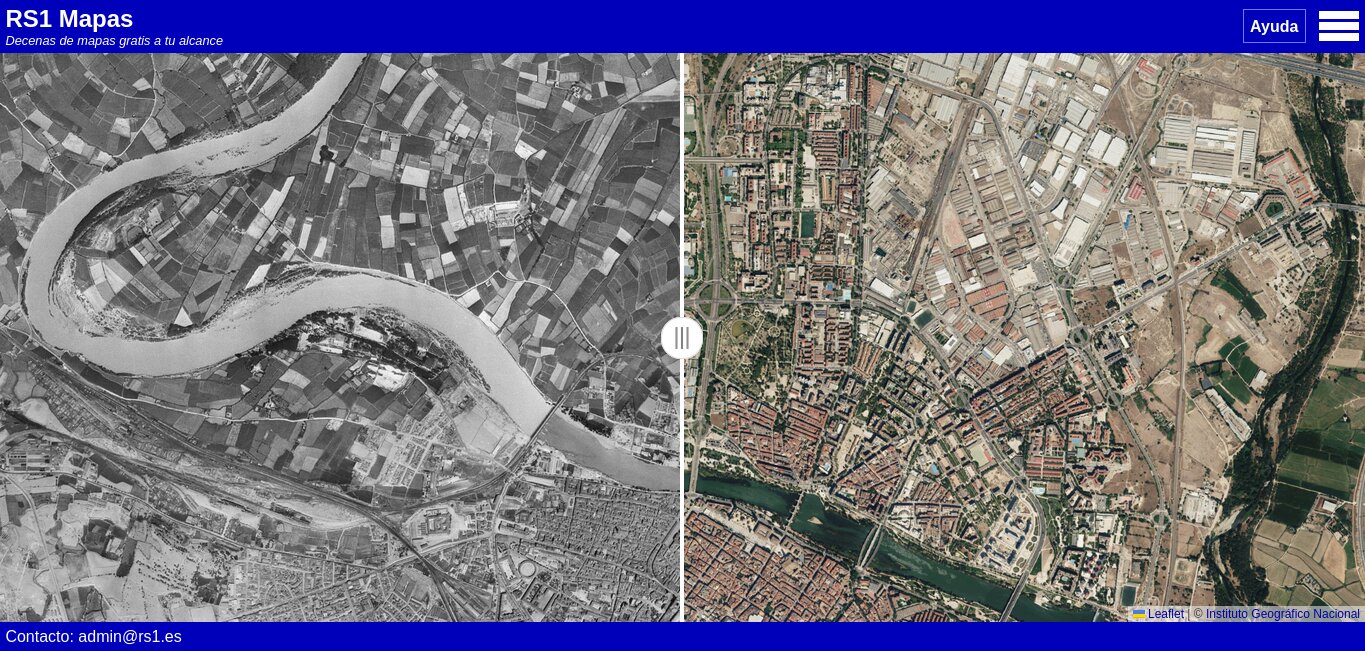
Huesca (1956 - Present)
Split screen showing images of Huesca in 1956-1957 and today.
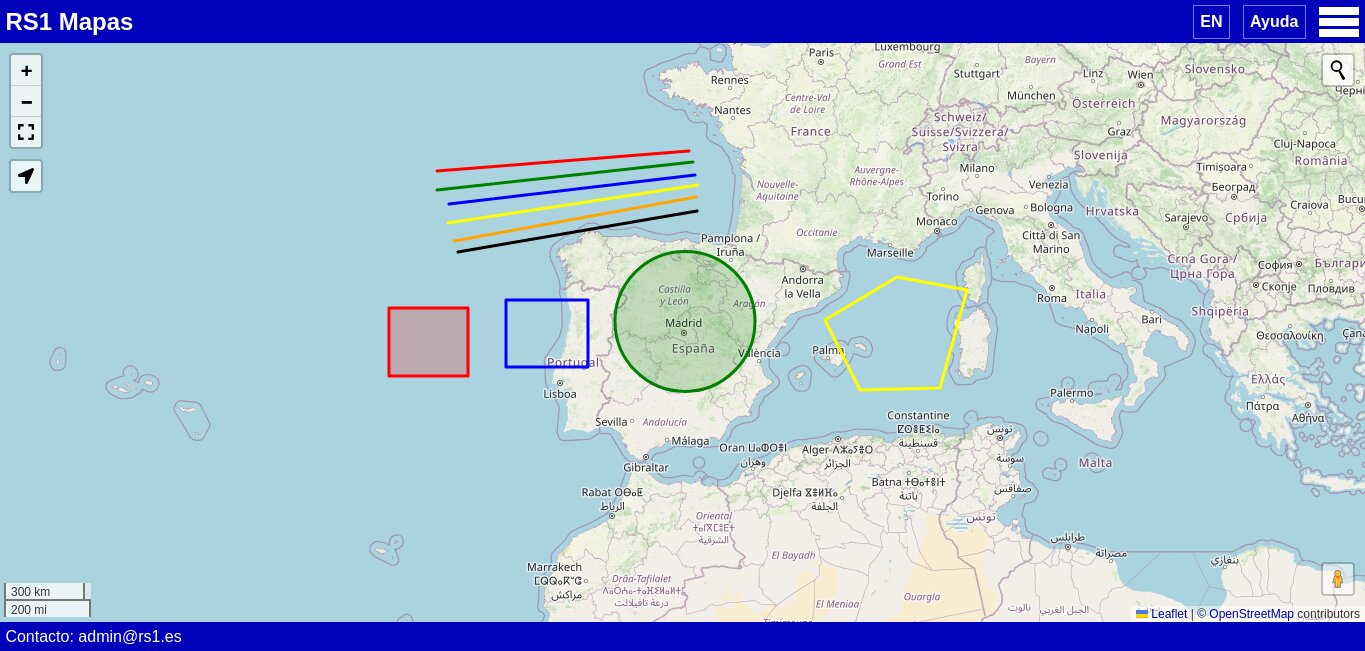
Drawing sample
It shows the shapes you can create on a map.
https://mapas.rs1.es/en/?z=5&lat=40.430224&lng=-3.779297&id=176052236310938
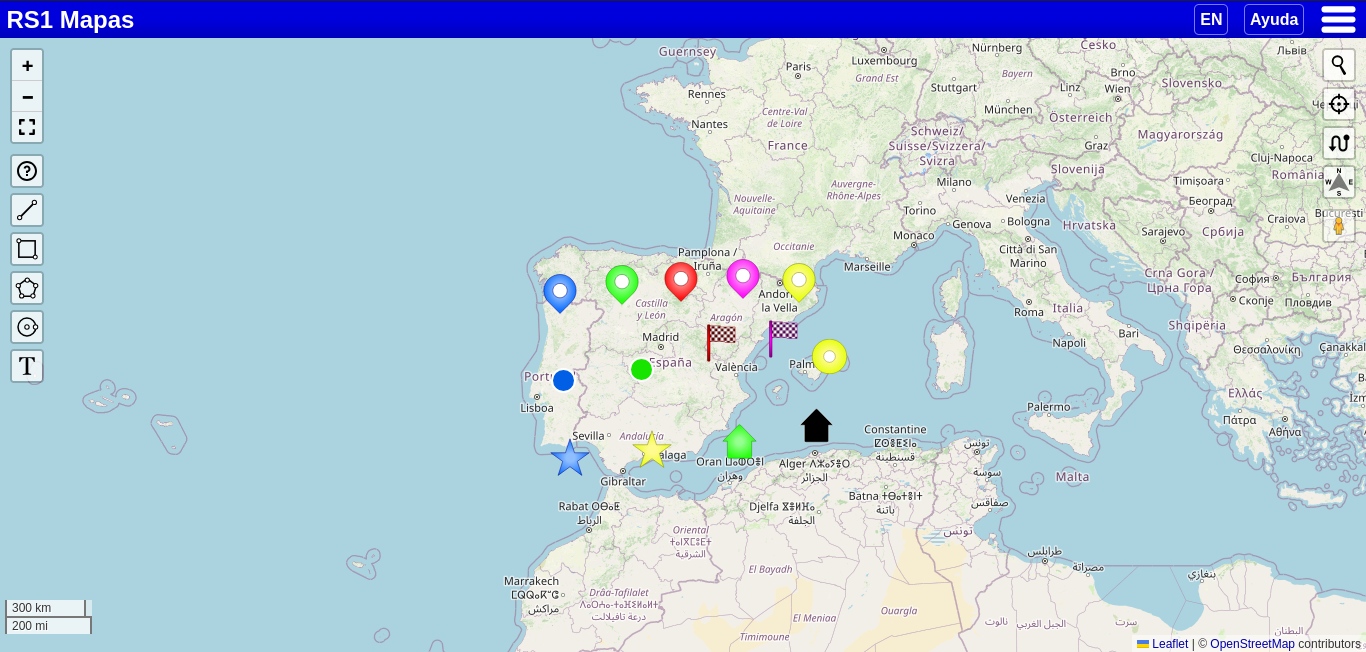
Bookmarks sample
The different styles that can be applied to bookmarks.
Conditional formatting and legend
Example of using conditional formatting to color polygons and using a custom legend.
Appendix 4: Other similar pages
If the services on this page do not convince you, you can, in addition to sending me your suggestions, consult these alternatives to RS1 Maps:
- uMap
- FacilMap
- Scribble Maps
- MapHub
- Mapforge
- Google My Maps
- National Geographic MapMaker
- MapDraw
- free-map.org
- Visualizador IDEE
- WMS Map Viewer
- Atlist
- Mapme
- Mapgoose
- GPS Visualizer
- Map Viewer
- TopoMapping
- World Map
- ZeeMaps
Appendix 5: Known issues
Horizontal or vertical lines sometimes appear (Chromium-based browsers): In Chromium-based browsers (and possibly also in Opera and Safari), when using tile maps, horizontal and vertical lines appear at certain zoom levels. I have added a script that reduces this effect, although at the cost of increasing the size of each tile by 1px, so slight differences between tiles may be noticeable, as well as seeing the lines in semi-transparent layers.
(Firefox Mobile): After using the keyboard and pressing a button (or hiding the keyboard), a dark bar appears: The bar disappears when you tap on the screen.
Anexo 6: Markdown
Markdown is a writing language that allows you to create rich text (with italics, bold, etc.) using basic symbols on plain text, making it easily readable both in its original form and once rendered.
Here is a basic example of Markdown text:
                # Title

                ## Subtitle

                **Bold**, *italic*
Once you convert this text to HTML format (using one of the tools available online), each symbol before or around the words becomes an HTML tag (for example: # Title becomes <h1>Title</h1>).
RS1 Maps supports this language in some of the available text fields (such as in the description of markers and drawings) and automatically converts Markdown to HTML when saving the text. Below is a small outline of the Markdown language so you can start using it in RS1 Maps:
- Titles or subtitles (remember to add a space after the symbol)
#: First-level heading, equivalent to <h1>##: Second-level heading, equivalent to <h2>- etc.
- Bold (add the symbol at the beginning and end of the text, without spaces)
**: for example:**Bold**__: for example:__Bold__
- Italic (add the symbol at the beginning and end of the text, without spaces)
*: for example:*Italic*_: for example:_Italic_
- Underline (in this case, an HTML tag is used)
<ins></ins>: for example:<ins>Underline</ins>
- Strikethrough (the symbol is added to the beginning and end of the text, without spaces)
~~: for example:~~Strikethrough~~
- Horizontal line (to separate two blocks of text, remember to leave a blank line both before and after)
---
- Links
<link>: Basic mode for creating a link, for example:<https://mapas.rs1.es>[Text](link): This mode allows you to add text to the link:[RS1 Maps](https://mapas.rs1.es)
- Images
: For example:
- Lists
- Text: For unordered lists, for example:- Value 1 - Value 21. Text: for ordered lists:1. Value 1 2. Value 2- [ ] Text: task lists:- [ ] Value 1 - [X] Value 2
- Tables
                    | property | property2 | property3 |
                    | -- | -- | -- |
                    | value1 | value2 | value5 |
                    | value3 | value4 | value6 |